Multivariate data, multiviews and interaction
This article I will cover how to:
- Understand the application of multivariate data
- Understand the functions of multiviews
- Datatypes defined by Ben Shneiderman
- Apply multiviews for exploratory and explanatory data visualization
Multivariate Data Analysis
Multivariate data analysis is the simultaneous observation and analysis of more than one outcome variable. Multivariate data are collections of dat in which many attributes (usually more than four) change with respect to one or more independent attributes.
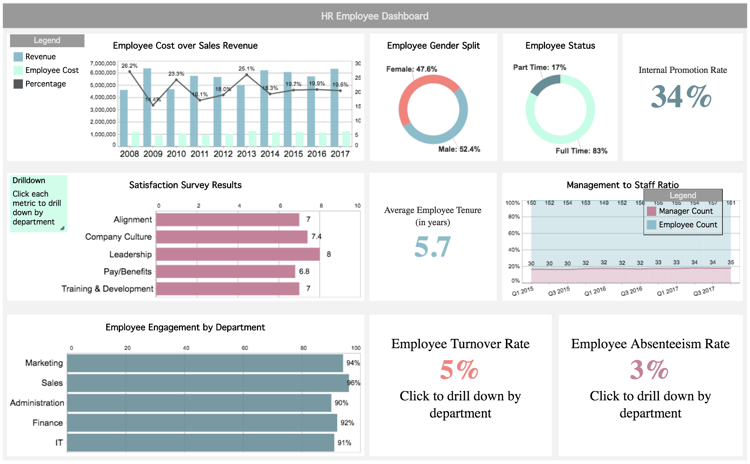
Think about comparing smartphones or computers. Each computer or smartphone has many features. How can these be compared without losing the overview? Multivariate data analysis is applied in organizations to support the process of decision making: Decision support systems. The use cases for dashboards are:
- Monitoring
- Exploring
- Reporting
Think about where you will place what information, in order for the viewer to get to best experience for doing analysis.
7 Datatypes of Ben Shneiderman
Ben Shneiderman proposed seven basic datatypes, a data fragment could be classified into, stating a taxonomy which allows to tag a datum with a certain category, determining how it can be used and which operators are applicable.
https://en.wikipedia.org/wiki/Ben_Shneiderman
- 1D linear
- 2D map (planar)
- 3D world (volumetric)
- nD/Multidimensional
- Temporal
- Tree (hierarchic)
- Network
1 Dimensional (1D linear)
Sequences of some data element (Character, numbers shapes).
Linear datatypes including textual documents, program source code and alphabetical lists of names which are all organized in a sequential manner. Unidimensional data is usually displayed as lists of items organized by a single feature (e.g., alphabetical order), so it is uncommon to see it visualized. A special case is when a data dimension has a narrow range of values repeated through the dataset, for example, the names of months or the department titles of an office.
These values are known in statistics as categorical data, or factors. A simple aggregation of these values can be used for the creation of distribution analyses in a further step.

2 Dimensional (planar)
Planar or map data including geographic maps, floorplans or newspaper layouts. Geographical features offer an excellent opportunity to help users locate data instances on a map. In combination with map templating engines, data instances can be placemarked using different symbols, thus allowing resources to be distinguished attending to their class.
The ability to pinpoint elements on a map may help uncovering element distribution patterns in the datasets, letting users identify the areas where resources are either tightly gathered or disperse. Advanced projection techniques can also enhance presentation by clustering elements together in association to the applied zoom level, or even addressing high-interest areas using heatmaps.
Planar data can also be found as an array of bi-dimensional features,
producing geometrical shapes which limit an area within a map. These
bounding boxes, when overlayed to a base map, provide great insights of
data which affect a greater geographical area, not just a unique, precise
point. Finally, bi-dimensional data does not only produce visual
representations on their own, but in aggregation with other data
dimensions can create augmented visualizations of greater value. Adding
labels, descriptions, images, etc. the map layout is enriched, making
geospatial data to be fun to interact with by any user. Furthermore, data instances can be collected by geographical areas (such as countries, states, etc.) and normalized, encoding each region within a pre-established color palette resulting in choropleth maps, or distort established borders to proportionally expose local contrasts over a set of variables using cartograms.

For example data with a genuine sense of “area,” such as maps, floor plans, and layout. According to Shneiderman, most visualizations can be placed in this category. Here the x and y data are the longitude and latitude.
3D world (volumetric)
Is this type data is plotted on x, y and z axis.

nD / Multidimensional
Data with more than 3 dimensions, such as relational or statistical databases where attributes can be thought of as axes in an n-dimensional space; typically uses multiple “layers” of 2D or 3D views.

Temporal
Temporal visualisation is a special case of 1D linear data, where the sequence of elements is based on time.

Tree
Data with a hierarchical, recursive structure, with elements (except the root) having exactly one parent; visualization approaches include outlines, 3D views, and space-filling treemaps.


Tree map
Treemaps display hierarchical (tree-structured) data as a set of nested rectangles. Each branch of the tree is given a rectangle, which is then tiled with smaller rectangles representing sub-branches. A leaf node’s rectangle has an area proportional to a specified dimension of the data.[1] Often the leaf nodes are colored to show a separate dimension of the data.

Treemap of soft drink preference in a small group of people. Colors and gradients are used to group items, while still identifying individual items.

TreeSize-generated treemap visualizing hard disk space usage
When the color and size dimensions are correlated in some way with the tree structure, one can often easily see patterns that would be difficult to spot in other ways, such as whether a certain color is particularly relevant. A second advantage of treemaps is that, by construction, they make efficient use of space. As a result, they can legibly display thousands of items on the screen simultaneously.
https://en.wikipedia.org/wiki/Treemapping

Network
A Network datavisualization can be recognised by the connections between datapoints, the colours and thickness of the connections. Network data visualisations are more exploratory than explanatory.
Have a look for an example of a network visualization: https://graphoverflow.com/graphs/stackoverflow-tag-relations.html
